How much does it cost an AI system to resolve one support ticket?
IBM Apptio is bringing more model usage into Cloudability. A help desk example shows how retries, human review and reopenings change the cost per resolution.
Two support teams run the same sort of AI assistant. One pays less for the model on every request. The other pays more per request but asks its agents to fix fewer answers. When the head of support asks which assistant costs less to operate, the token invoice alone cannot settle it. The unit they both need is a support ticket that stays resolved.
IBM Apptio announced new AI usage and cost connections on November 9, 2026. Apptio is IBM's technology financial management business, and Cloudability is its platform for tracking and allocating cloud spending. IBM says the new AI system connectors and Cloudability's AI unit economics capability are generally available, with more sources and enhancements scheduled later. They give teams more inputs for a cost calculation, while the team still has to define and count the outcome. IBM announcement and availability · IBM Cloudability overview
One ticket is a small enough unit to inspect. Follow it from arrival through model calls, handoff and resolution. Then compare two approaches using a week of tickets with the same definition of done. The result can explain what changed and whether the apparent savings are worth scaling.
IBM is connecting model usage to a broader cost record
The November 9 announcement describes direct connections for AI cost and usage across the Apptio portfolio. IBM also says Cloudability can incorporate application costing, usage and token data alongside cloud spending. AI unit economics and financial planning for AI services are listed as generally available, and the announcement places further unit economics enhancements in Q4 2026 and into 2027. The announcement establishes the feature scope and rollout status. Confirm that your billing source, account and usage fields are supported before depending on a particular connection. IBM release and availability notes
An assistant can incur spending outside its primary model call. It may look up a policy, rerank search results, retry a request or send a conversation to a second model. Storage, observability and the time an agent spends reviewing or rewriting a draft can matter too. Some of these costs come from invoices, some from an internal rate, and some from support operations. Treat them as separate columns so their owners can check the assumptions.
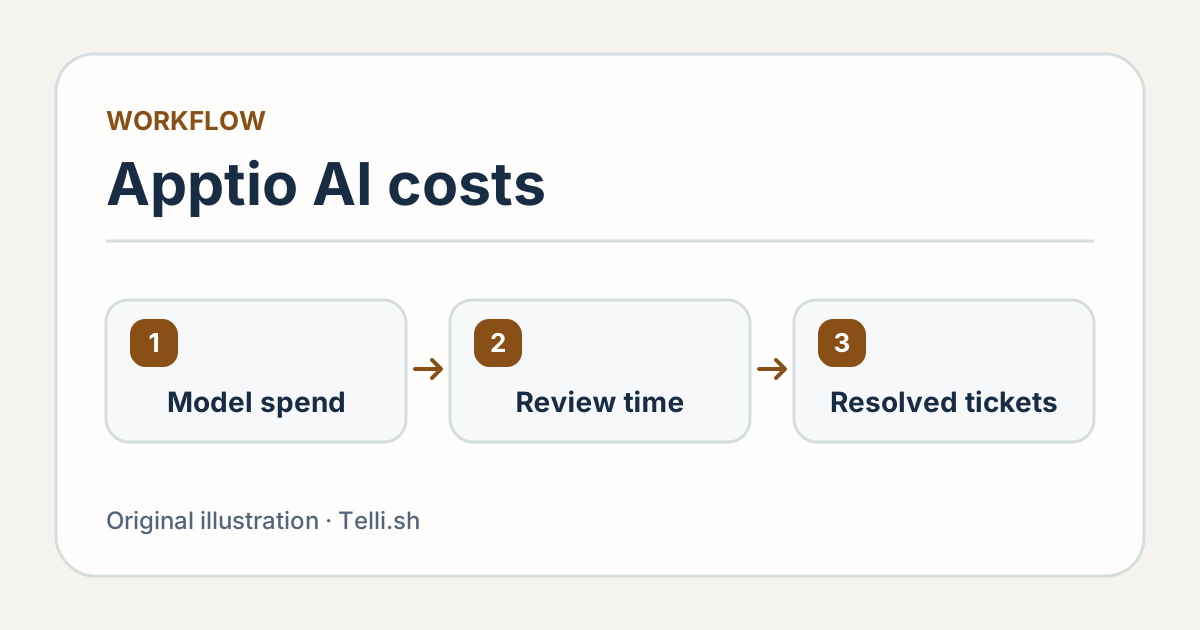
A support team can combine spending and workload records, then divide by tickets that meet a shared resolution rule. Illustration by Telli.sh.
A connection that reports model charges can make the first column easier to fill. A model identifier or workload tag can help attach a charge to the application that incurred it. The help desk still knows whether the customer received a usable answer and whether the same problem came back. The calculation only becomes useful when those records cover the same period and workload.
For example, an invoice may arrive on a monthly cycle while an assistant rollout changes each week. Keep a provisional number for the team's weekly experiment, then reconcile it with final billed usage when the invoice closes. Record which amounts are measured and which are allocated. A chart that moves after reconciliation can then be explained instead of causing the team to chase a change in behavior that never happened.
Define the resolved ticket before comparing prices
The denominator is the decision most likely to change the outcome. A support team can count each closed ticket once and specify how it handles a repeat contact. In the example below, a ticket qualifies if it is resolved and does not reopen within seven days. That seven-day window is an illustrative policy, not an IBM product default. Teams with a different customer journey should choose the period before collecting the comparison.
Decide how to handle tickets that leave the AI path. If your question is the cost of the entire supported workflow, count both AI-only and human-assisted resolutions, and include handoff and review time in the cost. If your question is how much autonomous resolution costs, also report the share of tickets that qualify without a human. Both are useful views. They answer different questions about the same system.
Track reopened tickets on their original identifiers wherever the help desk allows it. A customer who gets a quick answer, returns the next day and needs a person to finish the job can otherwise appear as two successes. For a fair comparison, wait until the follow-up window has elapsed, or label the latest group as provisional. A support dashboard can be prompt and precise about which it is reporting.
Check that two groups take similar kinds of requests. A password reset tends to have a different resolution path from a billing dispute or a cross-border return. Segment by issue type or route the pilot's comparable cases between variants. Without that step, a lower average could mean the second version saw an easier week.
A lower token bill can coincide with a higher cost per resolution
Here is an illustrative comparison with deliberately simple numbers. Each approach sees 100 incoming tickets. The teams use the same seven-day reopening window and report direct model and application costs plus paid review time. These figures are examples for explaining the calculation.
| One week of comparable tickets | Lower model cost route | Higher model cost route |
|---|---|---|
| Model charges | $12 | $20 |
| Other application costs | $5 | $5 |
| Review and rework | $43 | $27 |
| Total cost | $60 | $52 |
| Tickets resolved within the definition | 80 | 90 |
| Cost per resolved ticket | $0.75 | $0.58 rounded |
The second route pays $8 more for models and $16 less for review and rework. It also resolves 10 more tickets under the stated rule. The total is $52 divided by 90, about $0.58 per resolution. The first route is $60 divided by 80, or $0.75. This reversal can happen whenever operational cost and outcomes move by more than the model bill.
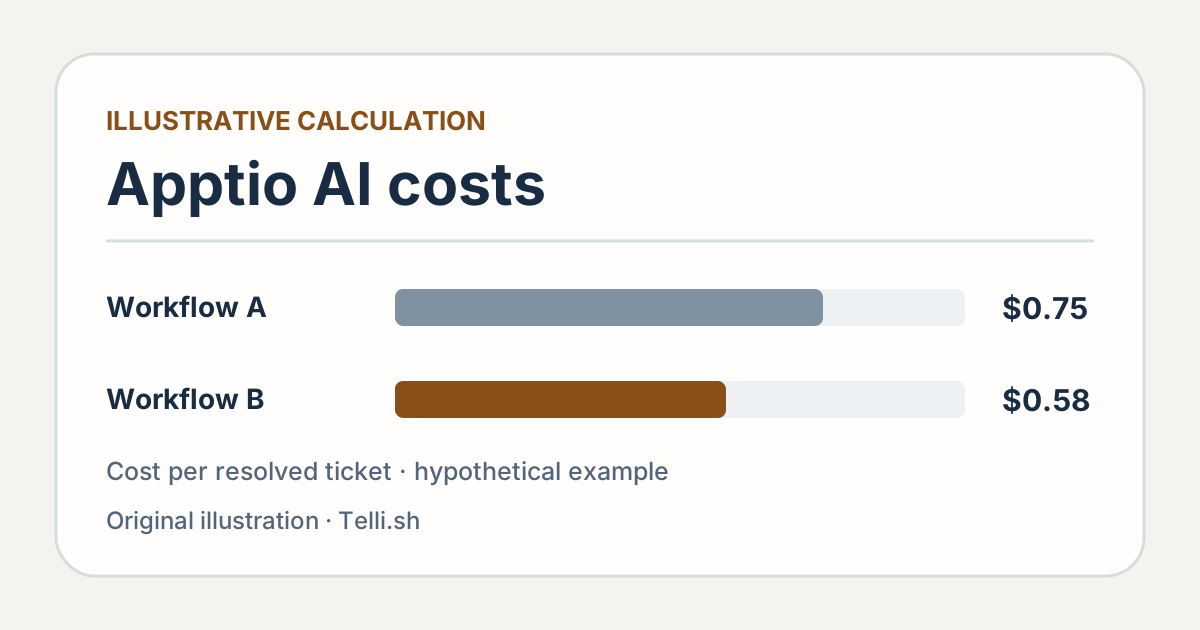
Illustrative numbers, not measured results. The route with greater model spend costs less per resolved ticket because it has lower review cost and more resolved cases. Chart by Telli.sh.
Now change one assumption. If the second route needs another $15 in review, its cost rises to $67 and about $0.74 per resolution. The two approaches are nearly tied. That is worth knowing before deciding how much time to spend on a model change. A result that flips after a small change in the labor estimate calls for better time measurements, not a stronger conclusion.
An average can also hide a service regression. A more expensive model could make a few difficult cases easier while taking longer to respond to everyone else. Add one or two outcome measures such as reopening rate and time to resolution. Keep those beside the financial figure so a team can see when the most economical version is still falling short of a service requirement.
Shared costs need an allocation rule people can inspect
One organization might run two support assistants on a shared retrieval service. If that service costs $90 in a week and half the requests come from each team, an even split is a reasonable provisional starting point. It becomes less representative when one team indexes substantially more documents or when queries in one application are much more expensive. Use the closest available driver and record the remaining shared cost explicitly.
A similar choice arises with reviewer time. If someone corrects a draft in two minutes, count the time needed for the extra step even if they would otherwise have been logged in to the help desk. To estimate the cost without recording unnecessary customer data, take a small approved time sample, aggregate it by issue category and apply a documented internal rate. A record of what was measured and what was assumed matters more than showing the final amount to the cent.
Plan for changes in traffic. A one-week pilot may have enough cases to compare common requests but too few of a particular kind to support a separate conclusion. For those cases, keep the observations visible and gather another period before changing the route. If a new team brings a different ticket mix, rerun the comparison with their distribution rather than multiplying the pilot's average by a larger number.
Keep the business result and ownership visible in the report. For example, show model, infrastructure and people costs separately under the total, and label which team owns each line. That makes the analysis actionable. If review drives the cost, the support team can look at which answers it rewrites. If a shared service drives the cost, platform engineering can inspect its allocation or usage. Neither group has to infer the next move from a single invoice.
Start with a week and reconcile it against source records
- Choose one workflow and one outcome. Document eligible ticket categories, what counts as a resolution, the reopening window and how you will handle a ticket passed to a person.
- Record the usage sources. In Cloudability or your existing cost report, identify the model charges and relevant infrastructure accounts. Check that the cost period, currency and workload IDs match the help desk extract. IBM Cloudability overview
- Attribute direct and shared costs. Attach application tags to the direct costs when available. List the distribution rule for each shared service and keep unallocated charges visible.
- Measure the work a person still does. Use an approved sample to estimate review and rework time. Join outcome counts at the smallest aggregate level needed to compare the two routes.
- Compare under the same service requirements. Recalculate after the reopening window, vary a key assumption, and inspect service quality before choosing a route. Reconcile the billed amount against the relevant invoice before using the estimate for budgeting.
If the workflow is already in production, use the existing model as the baseline and choose one behavior the team wants to improve. For example, keep the usual model on straightforward questions and evaluate a more capable model on escalations. Measure how often the routing decision leads to a better resolution and how much it costs. The cost breakdown can then support a change to the routing policy instead of a blanket upgrade.
A similar calculation applies to an internal policy desk. The cost includes a support assistant's search across approved policies, any follow-up and the time a specialist spends correcting it. The outcome might be a correctly answered question with a current policy reference. If the team chooses that denominator before looking at the prices, it can compare two routing choices without treating a fast answer with a stale source as an equal result.
Schedule a short review after the cost records close. Ask whether unassigned usage was large enough to change the decision, whether the reopening window captured typical follow-up, and whether the resolution mix shifted. Keep the data definition with the report. When the organization reruns the comparison with a new provider or model, finance and support can inspect the same assumptions instead of rebuilding the measure from scratch.
The invoice starts the conversation, and the customer outcome completes it
Apptio's November update makes more AI spending available inside the same financial view as other technology costs. That helps when the cost of a single outcome is spread across model providers, application services and people. For a support team, the next useful question is concrete. How much did the organization spend for the customer to get a resolution that held up? If the team can explain that number and repeat it next week, it has a basis for deciding where to invest.
Sources
- IBM Apptio AI spending announcement and availability, November 9, 2026
- IBM Cloudability product overview and official dashboard previews
- IBM Cloudability overview video
For a searchable record of the support reviews and operating decisions behind a pilot, Create a Telli.sh account.